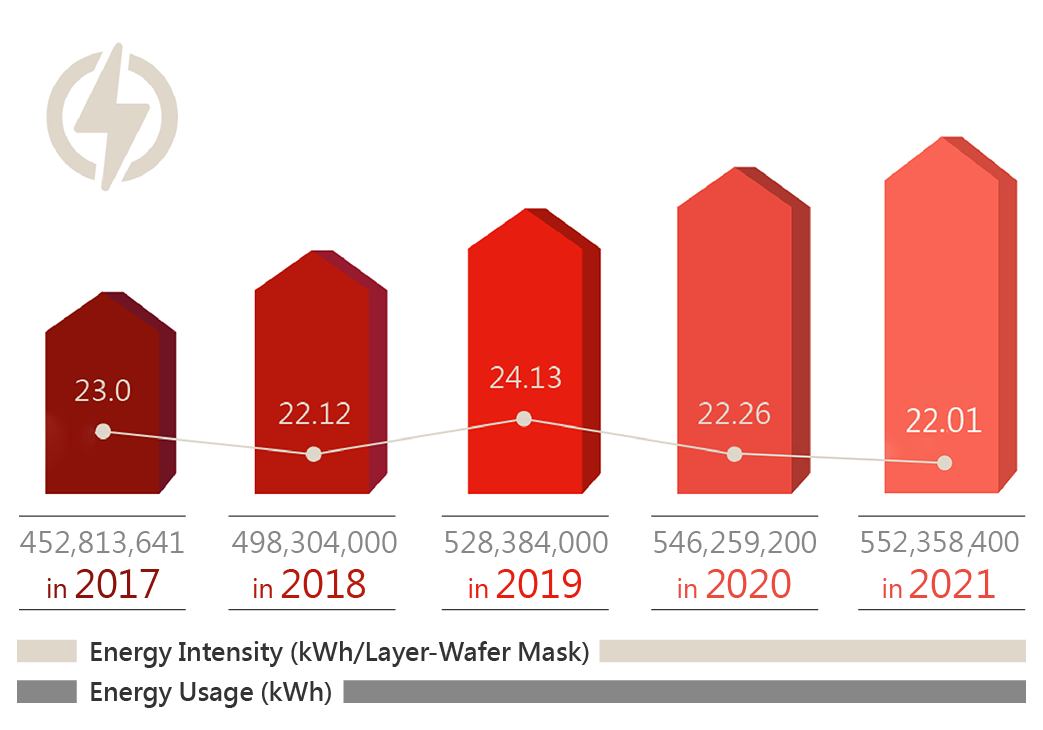
| Medium-term target | Electricity usage per unit of product until 2023 is not higher than 2020(≦ 22.26 kWh/Layer). |
| 2021 target | Electricity usage per unit of product is not higher than 2010(≦ 22.99 kWh/Layer). |
| 2021 achievement | Electricity usage per unit of product is 22.01 kWh/Layer. |
The plants are constructed based on energy-saving designs that help save energy in the plant management system. Using a supervisory control and data acquisition system (SCADA), energy use data are monitored and analyzed to achieve optimal management on energy reduction. Continuously promote energy-saving measures to reduce energy use.Winbond has always followed the principle of “optimal” material/fuel use to reduce consumption, waste outputand GHG emissions. Production costs are lowered at the same time, making it better both environmentally andeconomically.
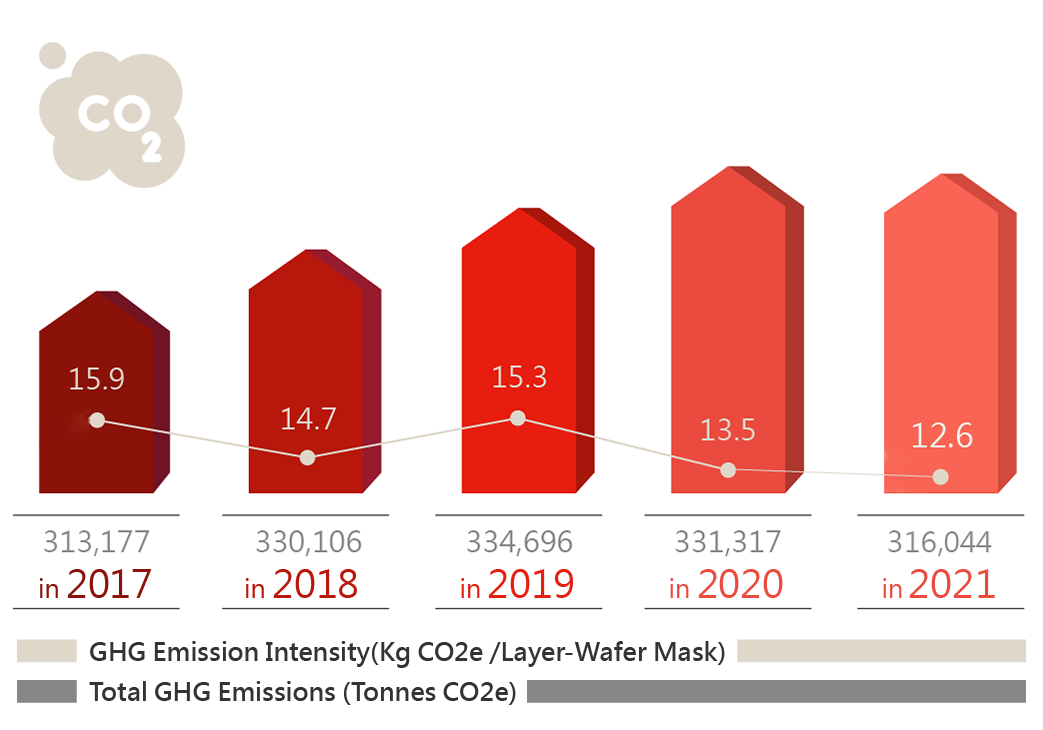
| Medium-term target | GHG emissions per unit of product until 2023 is not higher than 2020(≦ 13.5 kg CO2e/Layer) |
| 2021 target | 2010 as the base year, 8% reduction of GHG emissions per unit of product by 2020(≦ 15.1 kg CO2e/Layer) |
| 2021 achievement | GHG emissions per unit of product is 12.6 kg CO2e/Layer. |
Winbond actively cooperates withthe government’s push on GHG inventory registration by implementing GHG management measures at oursites, adopting the weighted operational control method, introducing ISO 14064-1, conducting GHG emissioninventories and verification, setting reduction targets and identifying reduction opportunities. We also proposeimprovement plans to progressively improve our GHG reduction performance.
At the same, Winbond has participated in the Perfluorocarbons (PFCs) Reduction of GHG emissions projects ofTaiwan and the World Semiconductor Council (WSC) from 2020. These involved process adjustments, use of alternativegases and installation of fluorocarbons (FCs) reduction equipment. We also secured reductioncredits through the EPA preliminary program to reduce GHG emissions, lower risk impact, and enhanceWinbond’s ability to adapt to climate change, improve our competitiveness, and create new opportunities. Suchinitiatives also prepare us for future GHG emission caps.
GHG emissions were verified byBritish Standards Institution(BSI) from the year of 2006. In according to the verification result, Scope 1 emissions are 65,749 tonnes of CO2e and Scope 2 emissions are 268,947 tonnes of CO2e for the whole year of 2019. Scope 1 emissions are 53,271 tonnes of CO2e and Scope 2 emissions are 278,046 tonnes of CO2e for the whole year of 2020.
The mainly emission of manufacturing stage comes from PFCs and electric power. Therefore, focusing on reducing PFCs gas and electric power not only reduce the overall amount emission of greenhouse gas efficiently but also can reduce the carbon footprint of products.
The main sources of GHG emissions at Winbond are FCs used in production processes and externally purchasedelectricity.The promotion of reducing PFCs plan and measurement, as follows:
- The usage of tool and its prevention facilities measurement of reduction rate and improvement.
- To carry out the evaluation of the usage of FCs tool.
- To carry out the selection evaluation of the new FCs processing prevention facilities